Projekt zu Klimawandel
"Klimadiagramme als Pädagogisches Werkzeug" und zur
"Standortanalyse Tropischer Nutzpflanzen"
- Sponsor gesucht - (mehr)

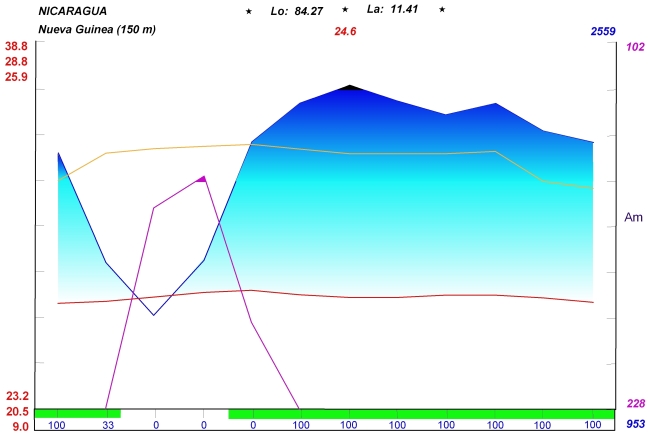
Agro-Klimadiagramm für Nueva Guinea, Nicaragua
Ein humides Klima transitorisch zu per-humid, graphisch recht gut an der vorherrschend blauen Farbe zu erkennen.
Diagramm mit Legende Liste weiterer Agro-Klimadiagramme
- (1992) pdf-Datei vom Autor, (3,3 Mb). Includes a Climatogram of an arid and sub-humid environment in bw.
- (1997): Forschungsvorschlag an GTZ – TÖB „TropenWald Forschung“: Nutrition of Organic Cacao For Buffer – Zones (Optimal Nutrition of Organic Cacao in Traditional and Improved, Low External Input Agroforestry Systems, to Contribute to the Stabilization of the Buffer Zones of the ‘Biosphere Río Plátano’, Honduras).
- (1995): Klima-Diagramm in Farbe mit Legende (810 kb)
Interessante Links zu Klimadiagrammen (in
weitgehend traditionellen Layout nach Walter & Lieth)
- Climate Diagrams in Wikimedia
- Climate Diagrams Links
- Climate Diagrams Program
- Cimate Diagrams Worldwide. There are currently 3233 Climate Diagrams from various weather stations from many different countries in the world. You can also create new climate diagrams.
- Climate Diagram Generator (for Germany, discontinued). Potsdam Institute for Climate Impact Research, 2006.
| Weitere Veröffentlichungen: 2004: + Guisela Chavarría: Mundança de atidude em relação a verduras y grãos básicos nativos (Gewohnheiten ändern in Bezug auf heimische Körner und Gemüse). Agriculturas – Experiências em Agroecologia 1 (1): 19-22 2004: + G. Chavarría: Cambio de Actitud hacia las Verduras y Granos Básicos Autóctonos: Su Papel en la Seguridad Alimentaria (Ändern von Gewohnheiten zu autoktonen Grundnahrungsmittel und Gemüse. Ihre Rolle in der Ernährungssicherung). LEISA - ILEIA Newsletter 20 (1): 29-31 2002: Proyecto Integral ‘Refugio de la Vida Silvestre Los Guatuzos’ Componentes Agroforestal y Seguridad Alimentaria (Integriertes Projekt "Los Guatuzos" mit den Komponenten Agroforstwirtschaft und Ernährungssicherung). Amigos de la Tierra, España 2001: Cacao Orgánico: Experiencias de Waslala, Nicaragua (Bio-Kakao: Erfahrungen aus Waslala, Nicaragua) 2000: Rubros Rentables para Zonas Remotas de Clima Húmedo-Cálido de Nicaragua (Rentable Kulturpflanzen für Abgelegene Regionen mit Feucht-Heißem Klima in Nicaragua. Cooperación Austriaca 1997: + Ruben Paitán: Producing Concentrate and Controlling House-Flies with Manure Traps. LEISA - ILEIA Newsletter 13 (2): 25 1997, + Rubén Paitán: Produciendo Concentrado y Controlando Moscas Caseras con Trampas de Abono. Agriculturas – Experiências em Agroecologia 13 (2) 1986: Möglichkeiten Artgerechter Eierproduktion in Bäuerlichen Betrieben (25Mb). Berichte aus der Betriebs- und Arbeitswirtschaft 2: 1-118 1986: Bewertungsfragen ‘Alternativer’ Landwirtschaft - Agrarbericht 1986. Lebendige Erde 5: 239-45 1986: Hühner - Zurück auf den Bauernhof! - Wirtschaftlichkeit der Eierproduktion in Freilandhaltung. (Bauernblatt) Bauernstimme 65:13 1980: Turm und Dorf können sie zerstören, aber nicht die Kraft, die es schuf! Bilder aus der Freien Republik Wendland. Marburger Zeitung 7/8-80: 20-21 |
|
|
|
|||||||||||||||||||||||||||||||
|
|||||||||||||||||||||||||||||||
|
|
|||||||||||||||||||||||||||||||
| Kooperationspartner
- Investor - gesucht für: Der Güegüense -
Gold Juwelen - Figuren aus dem ersten Theaterwerk der
prekolonialistisch,
nicaraguanischen
Literatur - Seite mit den Figuren und erklärenden Text |
 |
||||||||||||||||||||||||||||||
|
Direkte
Verbindung mit den Figuren (± 1 Mb)
|
|||||||||||||||||||||||||||||||
|
|
|||||||||||||||||||||||||||||||
|
|||||||||||||||||||||||||||||||
|
|
|||||||||||||||||||||||||||||||
|
|
|||||||||||||||||||||||||||||||
Kontakt:
Johannes Füssel (Deutsch, Englisch) jo.fussel«a»climatetool.es
Guisela Sacasa (Spanisch), g.sacasa«a»climatetool.es


